Three audiovisual tracks show seismic activity in the Reykjanes Peninsula, ICELAND
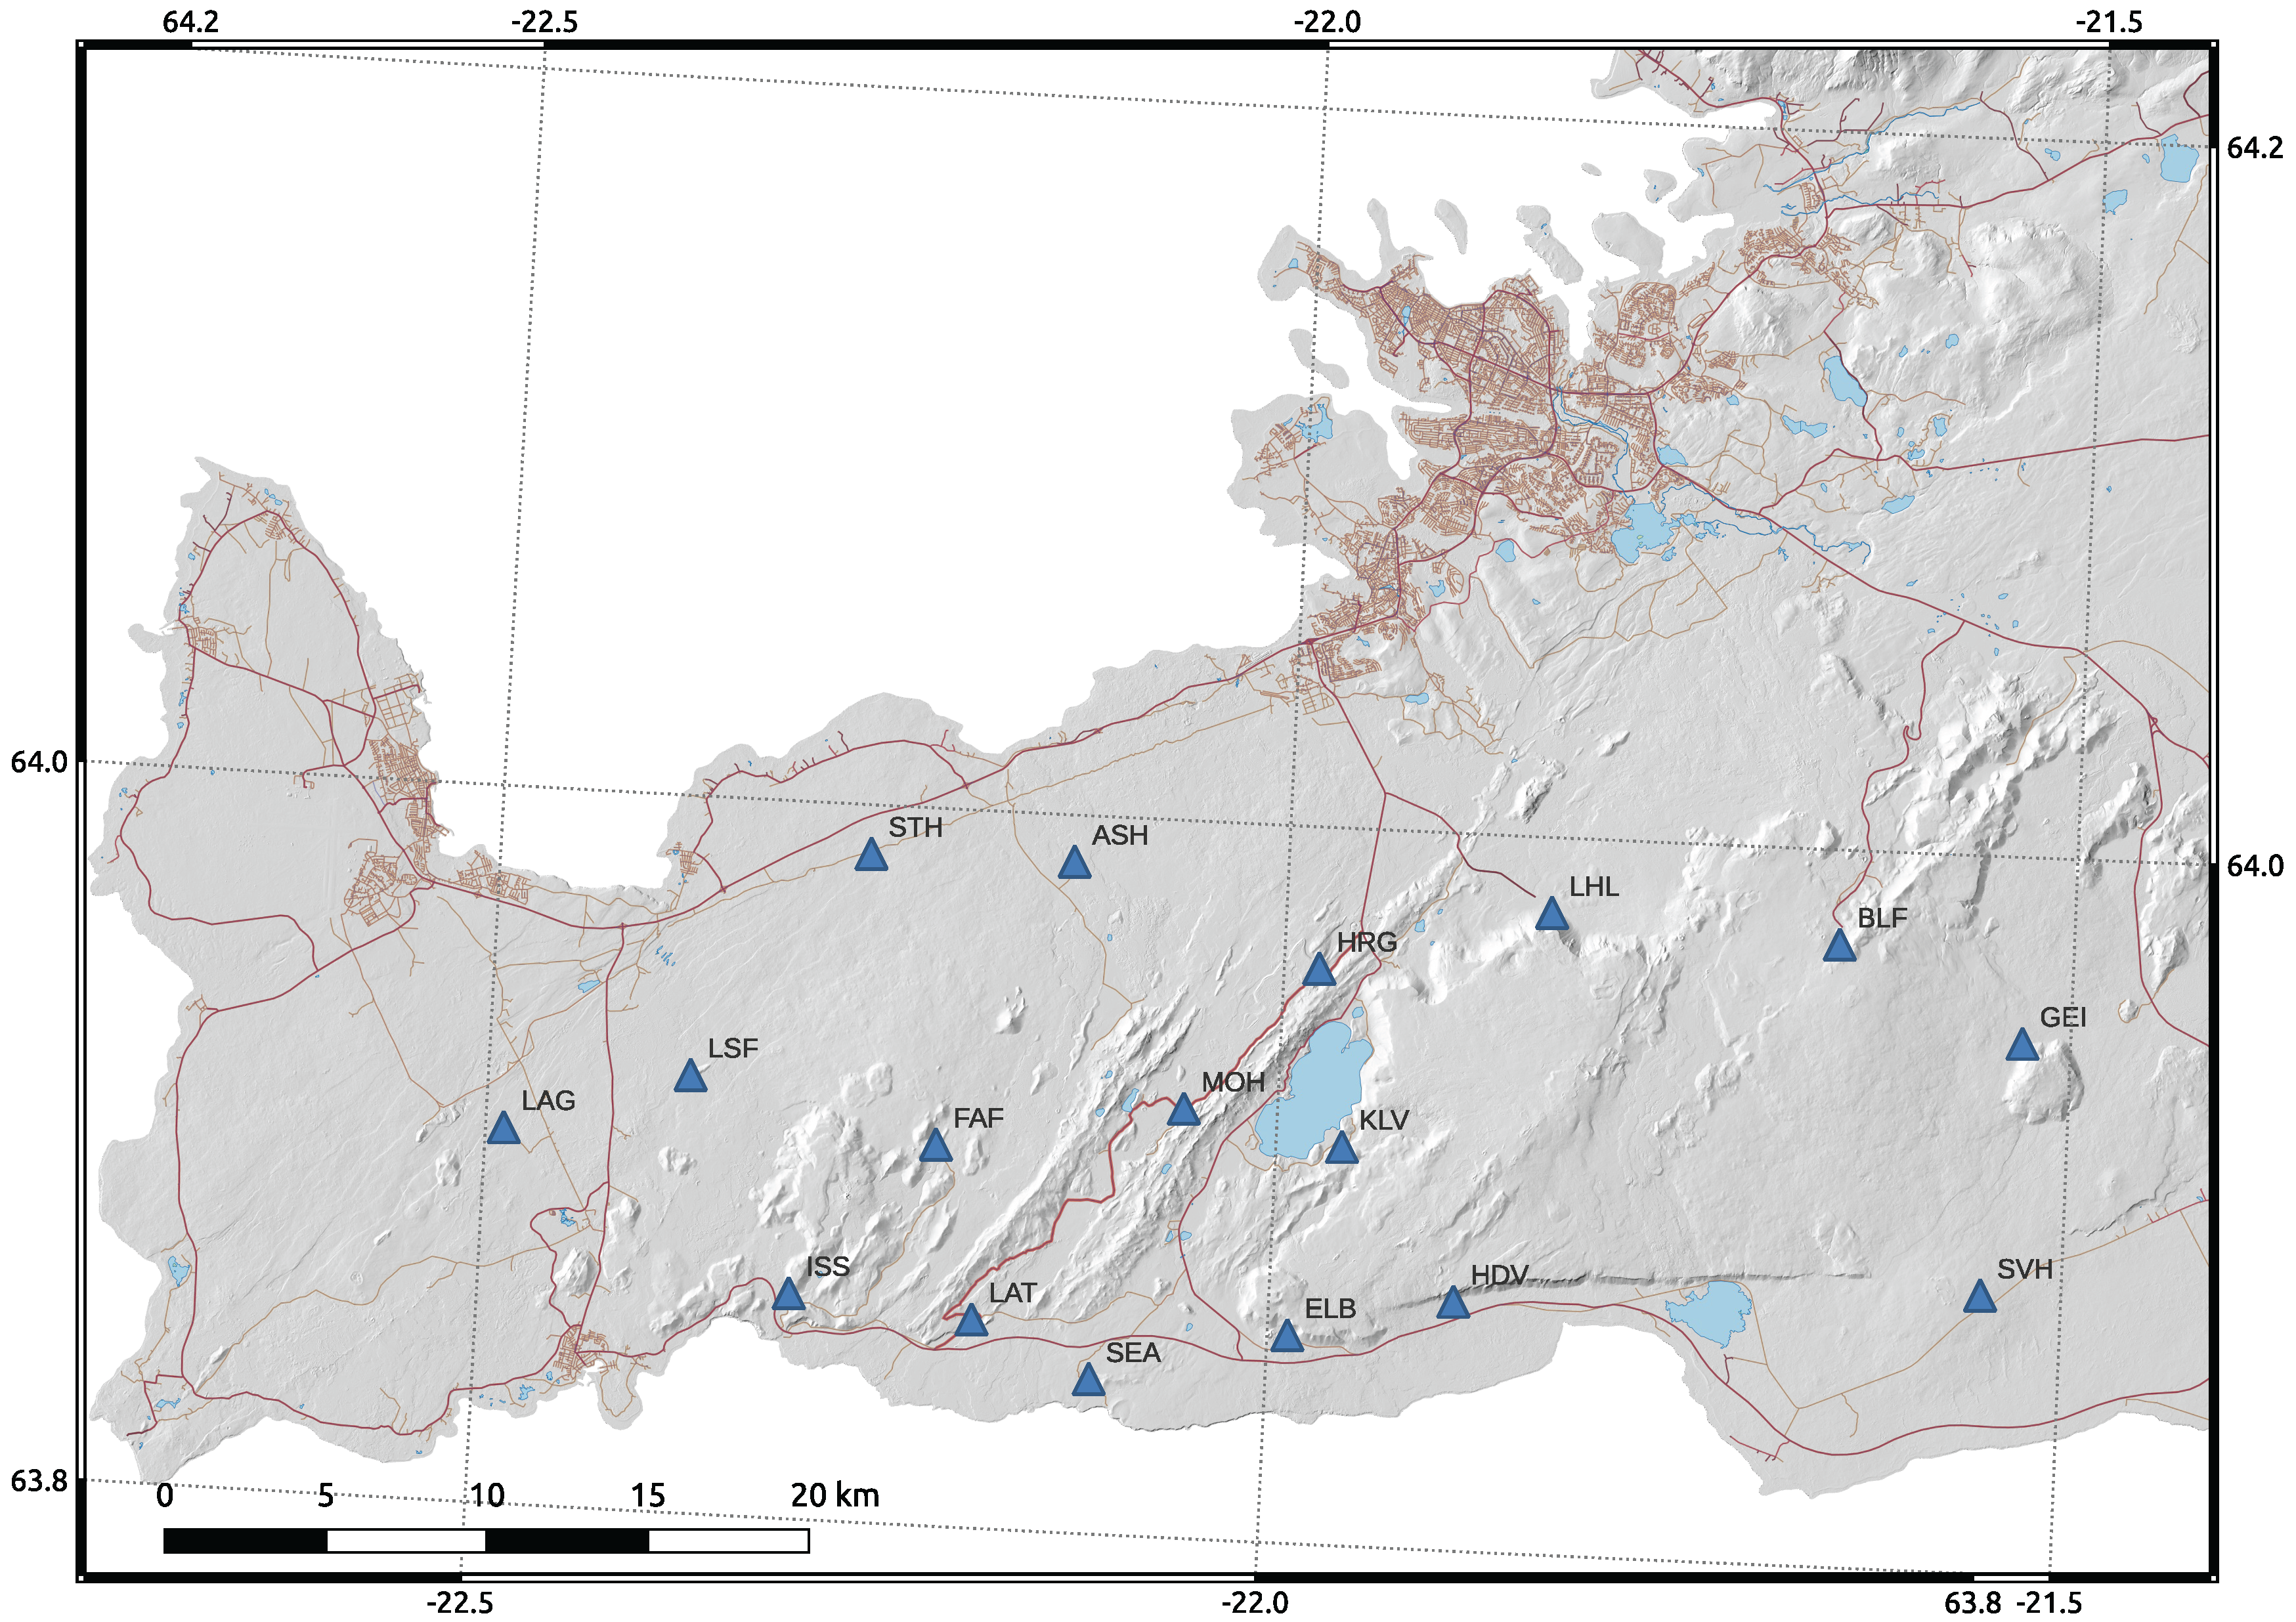
The earthquakes were recorded by the REYKJANET seismic network run by the Institute of Geophysics in southwest Iceland. The seismic data are converted to sound (sonification) and supplemented visually. The form of the scientific data thus takes on a completely different form. The sonification works with a basic description of the tremors (depth, strength and location). We prepared three tracks, each with a different intent and message, using different methods of converting the data to sound and of image production.

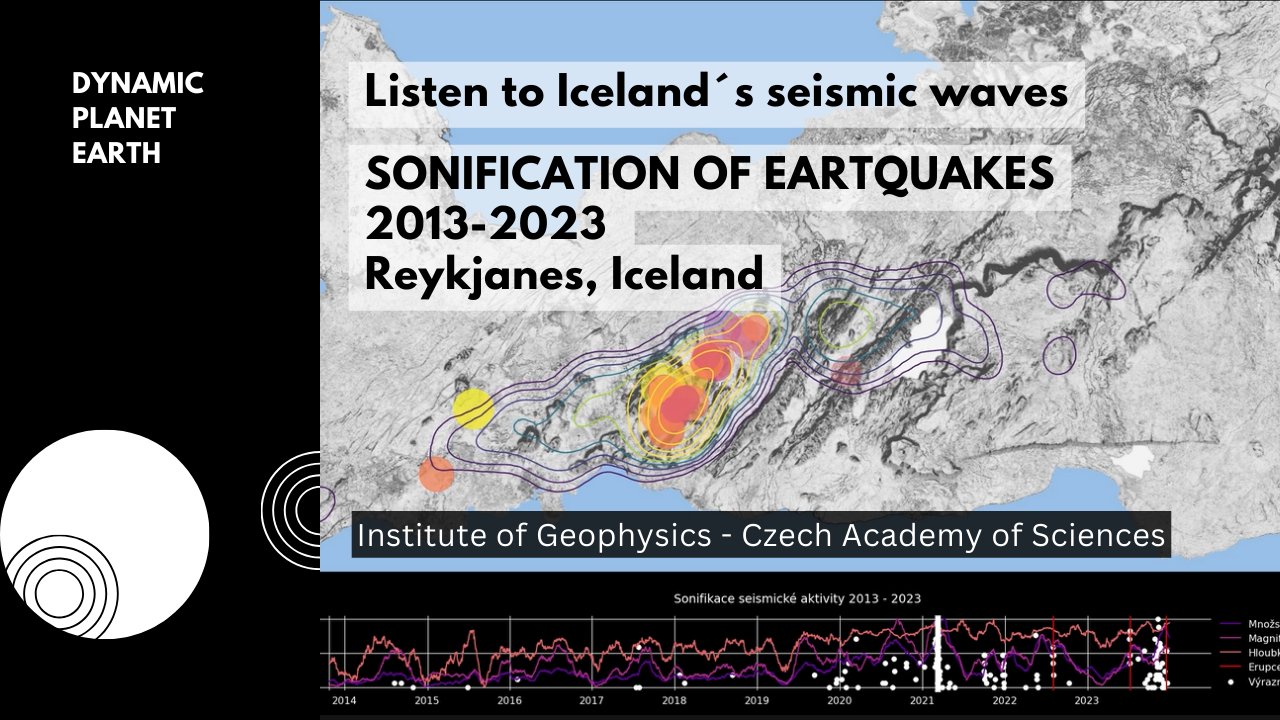
Listen to Iceland´s seismic waves. Sonification of earthquakes 2013-2023 in Reykjanes.
This track is based on the sonification of three variables: the number of tremors per day, their average depth and the mean magnitude (force of the tremor). The data is played at a rate of twelve and a half days per second, so 10 years in 5 minutes.
The sonification consists of a total of three sound layers:
– The first layer converts the three quantities into sound. The higher the number of tremors in a given day, the faster the tempo of the piece. The average depth of the tremors on a given day determines the pitch of the tone played. The magnitude of the tremors then affects the volume of the sound, the higher the magnitude the louder the sound of the song.
– The second sound layer shows the strongest recorded tremors greater than magnitude 3. Each of the tremors is played separately. The pitch indicates the depth of that particular tremor and the loudness of its magnitude. The tremor sound is created by the sonification of the wave record of one selected earthquake.
– The third sound layer represents volcanic eruptions. Its purpose is to indicate when seismic activity results in an actual eruption of lava to the surface.
The visualization is based on the locations (epicenters) and the amount (density) of tremors in a single day. These data are displayed as time-varying contours on a map of the Reykjanes Peninsula. The area bounded by the contours is given by the locations of the tremors (epicentres). The colour of the contours shows their tremors number (density) in the area. The strongest tremors are shown as coloured circles whose colour and size indicate the depth and strength of each tremor.
Sonification parameters:
Number of shocks per day – rate of triggering of the basic sample, 1000 – 40 ms
Depth – pitch of the base sample MIDI note number 79 – 41, lowpass filter 19900 -750 Hz, resonance 0 – 25%.
Magnitude – reverb length of the sample (decay 27 ms – 60 s); volume and intensity of the played sound.
Strong tremors – each more intense tremor sounds alone, triggers playback of sonified seismic waves, depth controls highpass filter, tremors at greater depth thus sound more attenuated.
Eruptions – one-time triggering of a sample recording of a volcanic eruption.
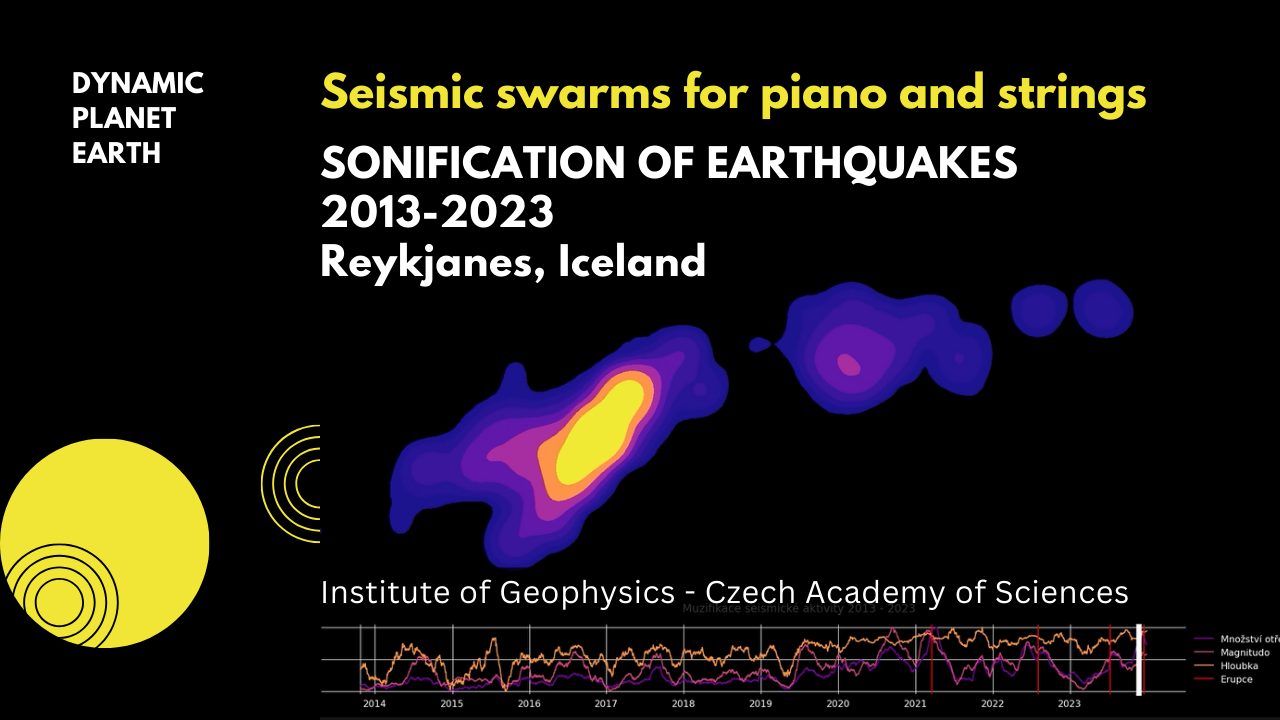
Seismic swarms for piano and strings. Sonification of earthquakes 2013-2023 Reykjanes.
The track is based on three variables: the number of shocks per day, their average depth and the mean magnitude. The data are quantized into discrete musical scales of a certain number of steps, which map to musical parameters such as timbre or harmony.
The faster and more colorful a pianist plays, the more tremors that took place on a given day. Earthquake swarms are colorful, composed of many notes played at the fastest possible tempo. Days with low seismic activity are monotonous, with the piano playing a slower monotone part. The piano is accompanied by strings representing the mean value of the magnitude of the tremors. This is represented by the intensity of the string part (the number of strings sounded at any given time). The more strings you hear, the stronger the shaking during that period. The variable common fundamental tone of the strings and piano expresses the average depth of the measured tremors. The strings and piano are complemented by a gong strike whenever an eruption occurs.
The visualization is based on the locations (epicenters) and the amount (density) of tremors in one day. These data are displayed as time-varying contours. The area bounded by the contours is given by the locations of the tremors (epicentres). The colour of the contours shows the amount (density) of the earthquakes in the area.
Map of sonification parameters:
Number of tremors per day – tempo (8 steps, ¼ – 1/64) and number of notes of the piano part (1 to 8, each step increases the fundamental by a small third).
Depth – pitch of the key (fundamental tone) of the piano arpeggio and string section, 8 steps in intervals of a fifth, an octave.
Magnitude – the number of voices in the string section (8 steps; from none, to the highest, to the bassiest, the distance between voices is always one octave).
Eruption – a strike on the gong.
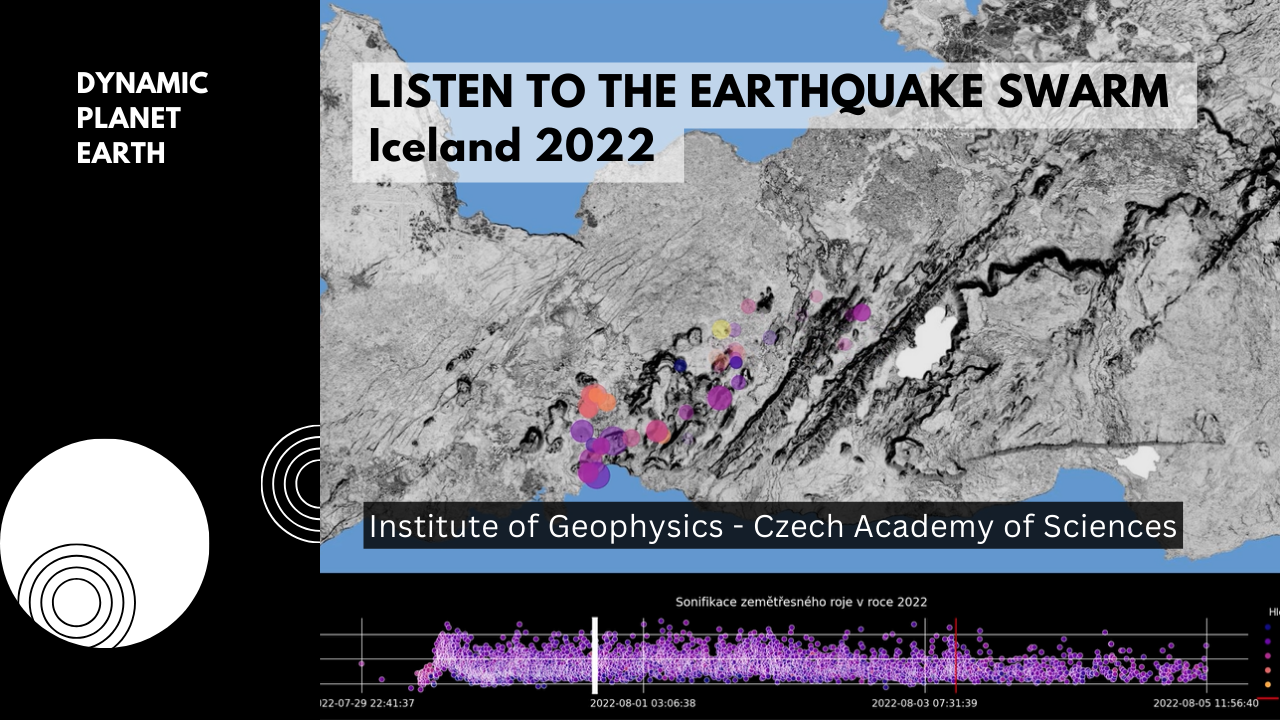
Listen to the earthquake swarm in Iceland in 2022
This sonification is a faithful sonic model of earthquake activity – every single registered tremor in the period from July 29 to August 5, 2022. During this period there was a lava outburst in the area. The recording of seismic activity for the period is played back at an acceleration of 1000:1 (one second of the track represents 16.6 minutes of recording, 6 days – about 10 min).
Each recorded tremor triggers one sample of the sonified earthquake waveform record. The sample is triggered by a note of a certain pitch, with a certain duration and a certain volume. The pitch of the tone of the sample played indicates the depth at which the shaking occurred; the duration and volume of the playback reflect the strength (magnitude) of the shaking. During the track, a recorded recording of the lava eruption will be played at the time it occurred in the area and period of interest.
The visualization is based on the depth and strength (magnitude) of each tremor. These are shown as coloured circles, the colour and size of which indicate the depth and magnitude of the individual shocks.
Map of sonification parameters:
Depth – the pitch of the tone of the sample being played
Magnitude – the volume and length of the sample being played
Eruption – start of the volcanic eruption recording
Authors: Cyril Kaplan (FF UK) and Vlastimil Koudelka (NUDZ)
GFÚ: Matěj Machek
“Listen to Earthquakes” was created for the exhibition of GFÚ – Dynamic Planet Earth at the Science Fair 2024
The combined sensory perception provides a different and more powerful experience and our experience of the data takes on a deeper quality.


